
Hello Steemers!

Doing an update for ETH/BTC today, last one was on Jan. 02. (@ozchartart/usdeth-btc-poloniex-technical-analysis-jan-02-2017)
I added some yellow lines(0.0372, 0.0578, 0.1531) on the weekly and light blue on the daily chart
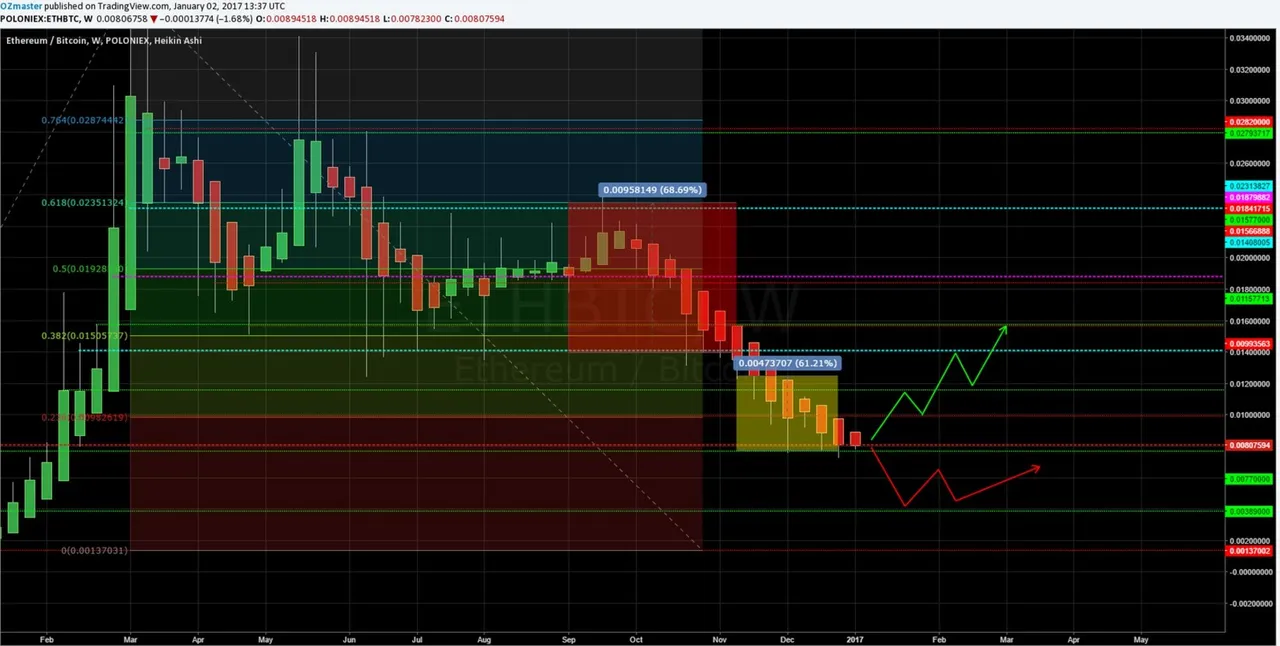
weekly chart Poloniex - Jan. 02, 2017
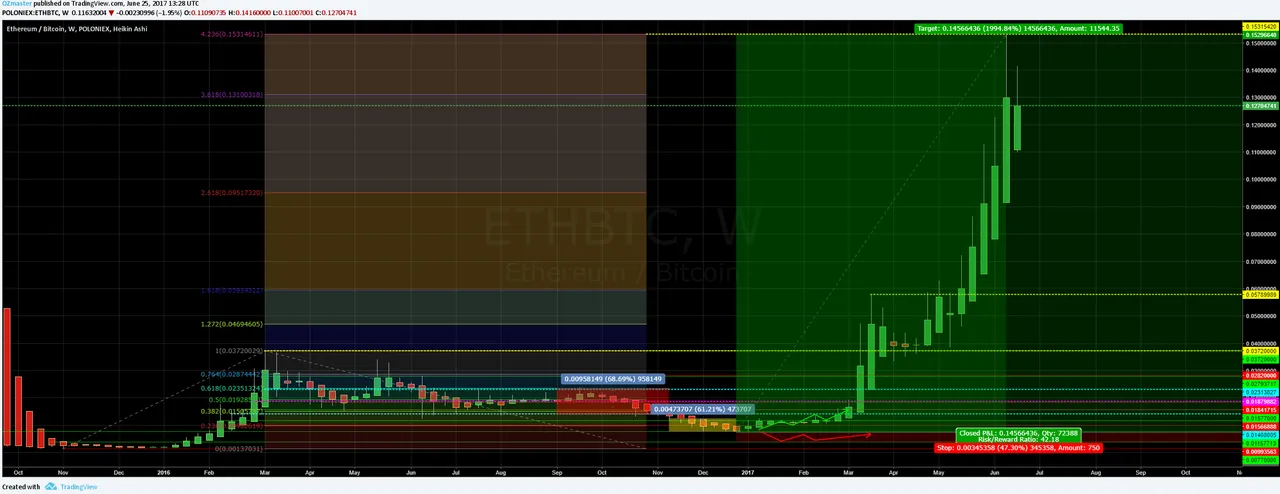
weekly chart Poloniex - June 25, 2017
Since the beginning of the year ETH has changed the trend, going into a very mild uptrend till March when it then started to go up with big gains, first reaching a new high at 0.0578 BTC (also near a (blue) Fibonacci line), and then shortly after a small retrace continued with and even stronger uptrend making a new high at 0.1529 BTC hitting the highest Fibonacci target, making the overall rise since January count for an amazing 1994.84%!
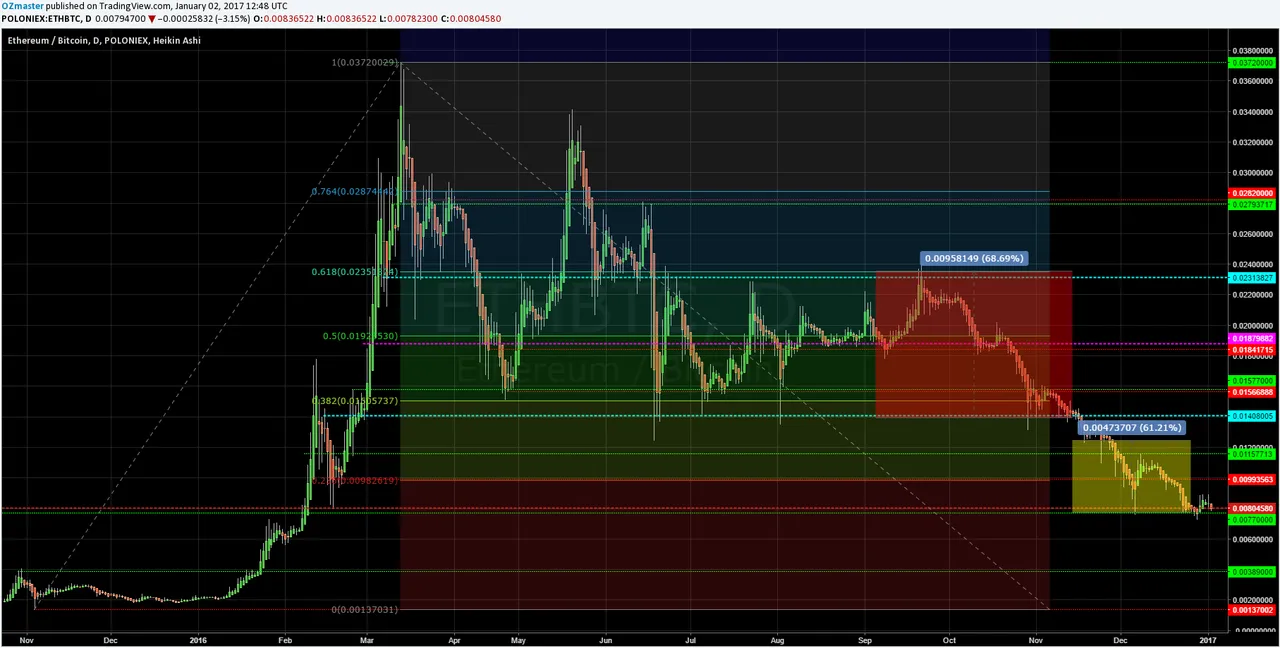
daily chart Poloniex - Jan. 02, 2017
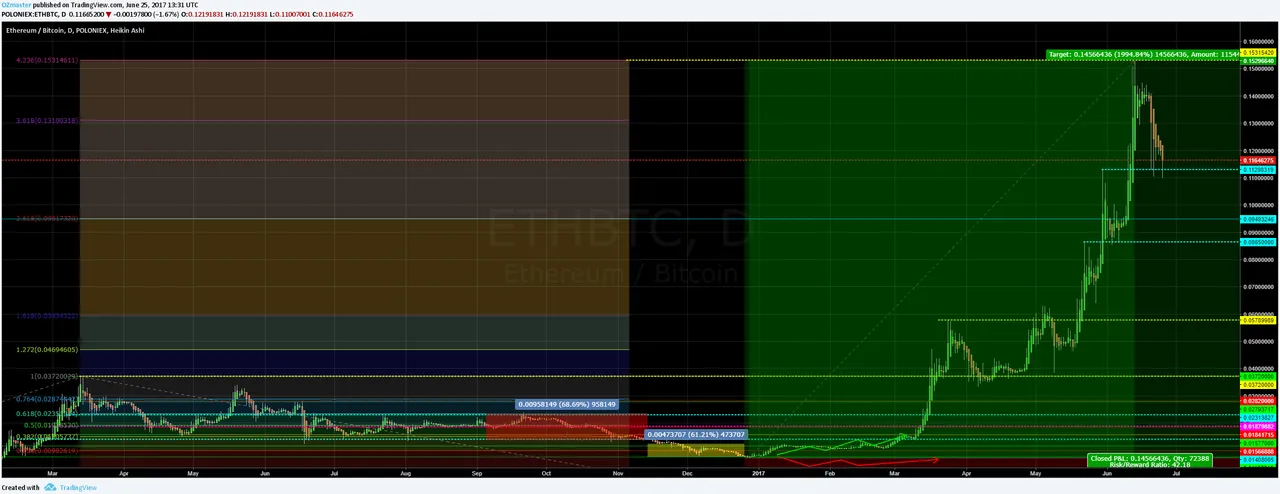
daily chart Poloniex - June 25, 2017
On the daily chart you can see the waves that the price was doing while going towards the high, and the drop is becoming more and more clear now on the daily chart with the price being traded just shy above the 0.112 BTC line while it already spiked a little bit bellow it twice.
COMMENT
Once again, I will post the comment by commenting as it involves my personal opinion!
Thank you for understanding!
If anyone has any questions or need's help fell free to ask, I will try to explain as fast and as best as I can.
Critics, comments, reply's, counters, advice's, etc. are always welcome!
Have my charts helped you in any way?Let me know with a comment below :)
Are there more people who are doing TA?
Please post the links to your TA's posts into the comments as well!
DISCLAIMER
I am showing multiple scenarios on the price movement, in the post itself I do not take any stance, either bullish or bearish. I am not responsible for neither you’re winning nor you're losses upon trading! the "comment" section is my personal opinion and does not mean I have to or do hold any positions in the given market.
Everyone who uses TA develops his own unique charting style, please keep that in mind.

Kind Regards, OZ :)