
Ethereum is trading again in red or weakness today. Though range is shallow today between $282-$265 but still signals are bleak for revival of uptrend.
Before going further in discussion of those signals, lets take a glance on chart below.....
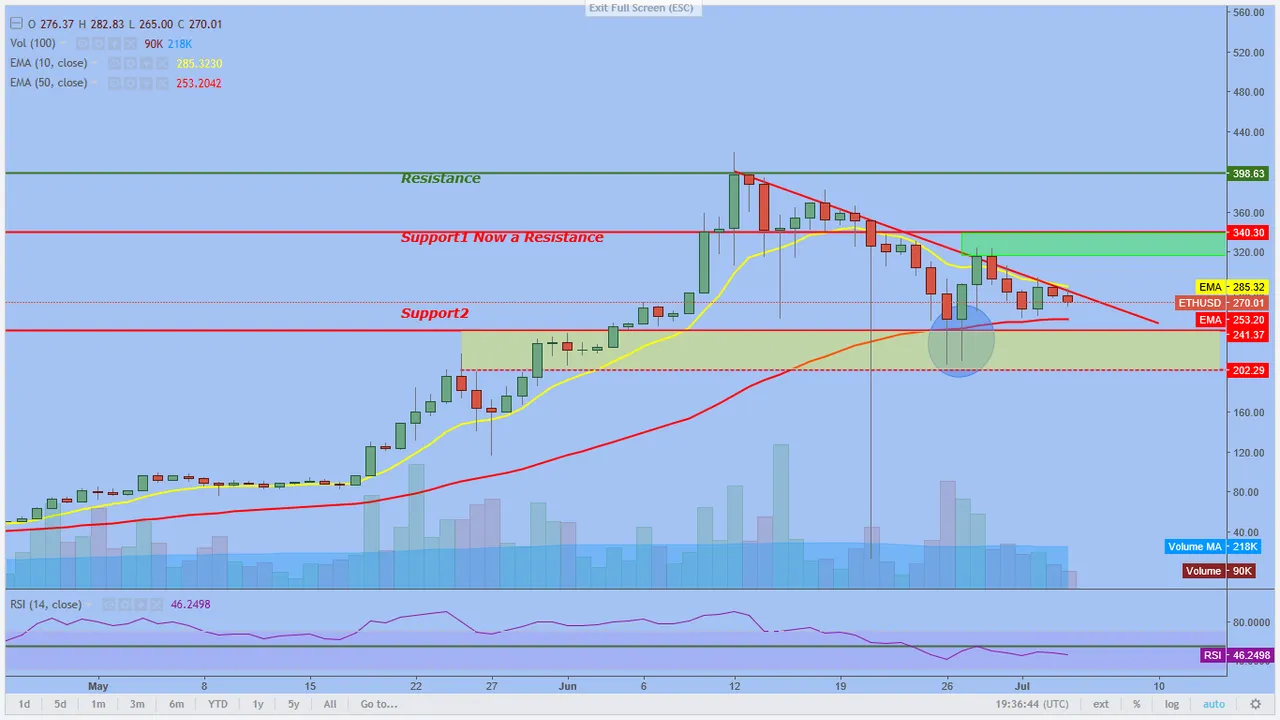
In chart there are following point to observe:-
- Falling Trendline: Ethereum hit a high of $420 on 12/06/2017, and since then it has been going down, and this downward trend is marked by me in the form of red colour diagonal line, which is know as Falling trendline. So , this trendline is indicating a downtrend in ethereum prices and it also a kind of indication to trend change if breach and sustained on upside, but that movement is yet to be seen.
- 50 Days EMA: Red wavy line on chart above is 50 Days EMA which is currently at $253.16. This moving average has provided decent support to falling prices of ethereum as it has been tested multiple time , but each time Ethereum prices just bounced back. But as you can clearly see that point of test is again approaching as Ethereum which is trading currently at $269 level, can again test this support because of weakness in momentum.
- 10 Days EMA: Yellow wavy line on chart above is 10 Day EMA which is at $285 level. This moving is providing resistance along with falling trendline, and also distance between 50 day ema and 10 days ema is contracting, if this downward momentum continues then 10 days ema will cross 50 days ema on lower side which will be a very bearish signal , but this scenario yet to happen, but one should keep a close eye on this occurrence.
________________________________________________________________________________
Now the summary
If i sum up all above point, then i came up with conclusion that ethereum is still weak, correction is still going on, rsi indicator too has broken support but has protection also in form of 50 days ema and supporting zone marked in yellow highlighted area. But Ethereum is also trading close to falling trendline, so if Ethereum gives two close above falling trendline and 10 days ema , one can then say that trend has changed and correction is over, but until then just wait and see the next course of action of this script.
________________________________________________________________________________
If you like my analysis do not forget to upvote, follow, comment@jimmyrai28
if not then criticize, this also will be highly appreciated.
You can also drop a comment in 'reply' if want you want me analyze any script of your choice.
Now you can also find me on discord channel: https://discord.gg/VvHmhvH