
Ethereum Classic has been moving very positively for last many days. This post is just a short update to show a power of chart, if read and follow correctly can help in making good gains and profits.
It is currently trading at 0.06973 Satoshi and I have recommended to buy this script at around 0.05264 on 17/06/2017 and you can view that update by clicking below link or watch chart of that day here....
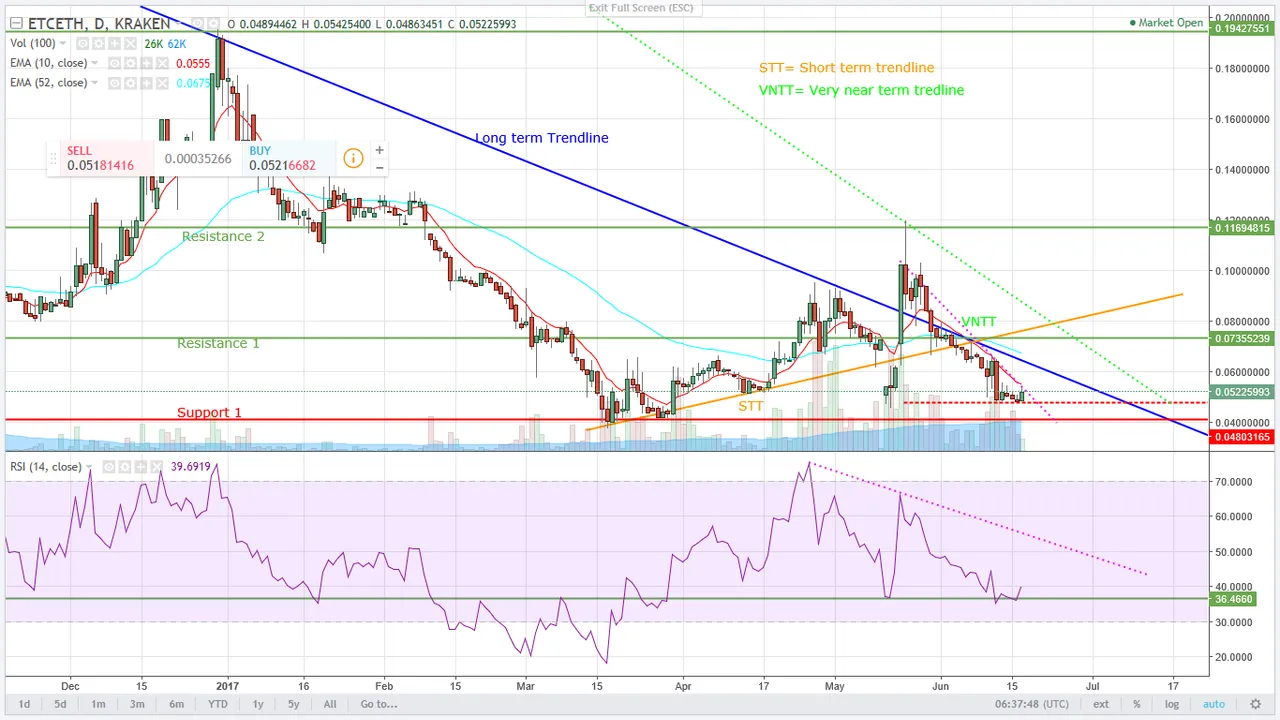
Then on 19/06/2017, i made another update and that time it has already gone up and was trading at around 0.5996 Satoshi and that time its about to touch a resistance of falling long term blue colored trendline after crossing 10 Days EMA and you can view that update by clicking below or watch chart of that day here....
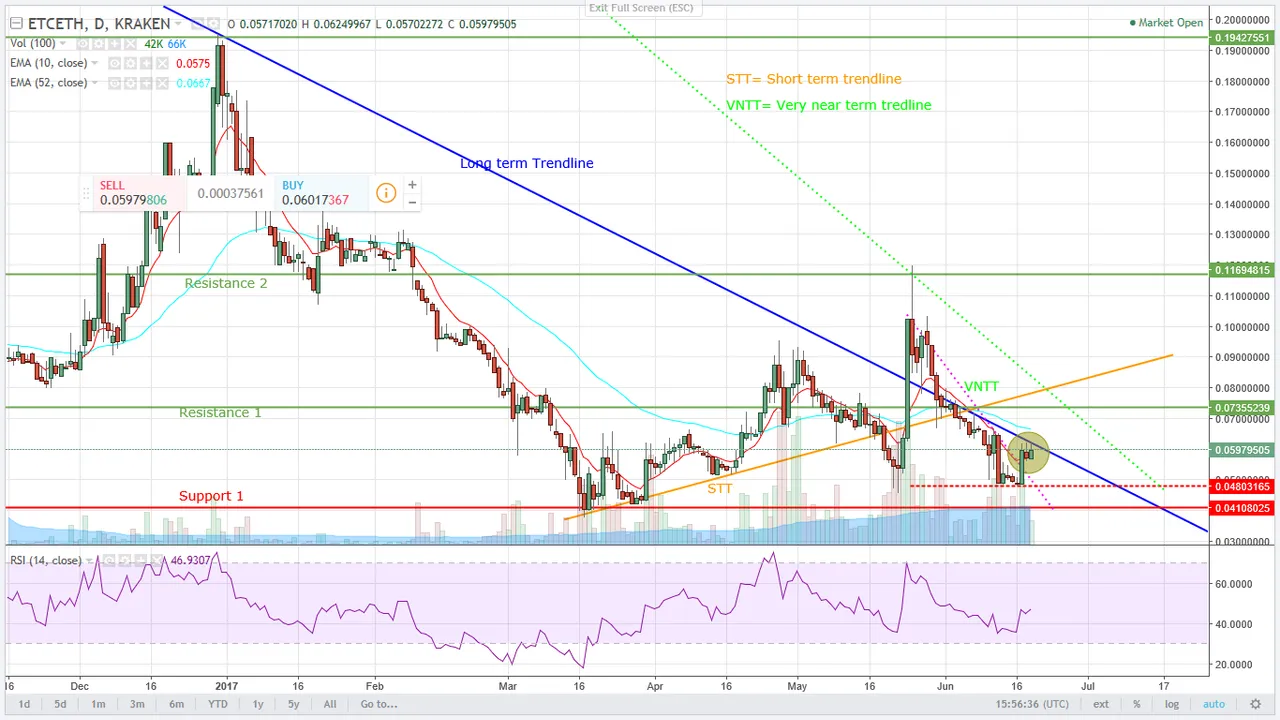
And today it is trading at 0.06974 Satoshi level and you can see in chart below that it not only has cleared 50 DAys EMA with good volumes yesterday,but also sustaining above it at today's trading session up til now.

_________________________________________________________________________________
In conclusion i again repeat it was not a mere prediction on 17/06/2017 to recommend buy, but it was summary of chart reading that day and this is how one can benefit by learning and reading a charts without having real fundamental knowledge of any given script. And i end this conclusion by saying again following:-
Charts are the king and Trend is your friend
_________________________________________________________________________________
If you like my analysis do not forget to upvote, follow, comment @jimmyrai28
if not then criticize, this also will be highly appreciated.
You can also drop a comment in 'reply' if want you want me analyze any script of your choice.