
Bitcoin has been trading in green or in bullish bias for last three days. It is trading at $2619 level currently and made a high of $2636 and low of $2542 today. It had gone in correction mode after hitting a high of $2999.9 and made low of $2050, but then it recovered to about $2800 level and again hit a low of $2258. Now the question, is correction over?
To answer that, lets take quick look at chart below.........
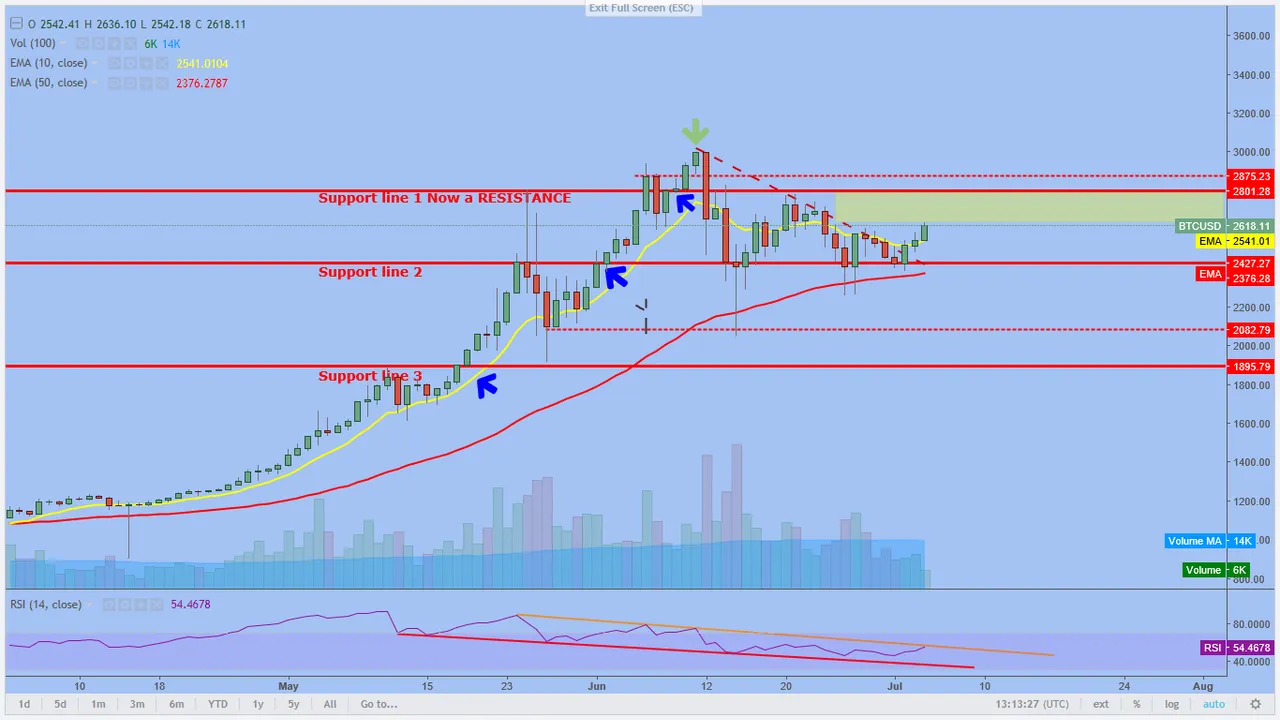
In chart above there is following points to notice:-
- Horizontal Support Line 2: This support line is at $2427 level , which has provided a good ground to Bitcoin. Bear do manage to break this support on multiple occasion but each time Bitcoin manage to close above this support. So sustaining above this level is itself a solid case to announce that bears hasn't have stronger hand.
- Dotted Falling Trendline: This is red dotted line in chart above which signify a downtrend in Bitcoin Price. Now, Bitcoin has already given two close above this trendline, which means a trend has changed from down to up , hence one can say correction is over for now.
- 10Days EMA: This moving average is yellow wavy line on chart above which is at $2541.67 level. Yesterday, bitcoin manage to breach this trendline on upside and also closed above it. Today, this script is again trading above level and volumes bar at bottom of chart is also showing okay kind of volume level to back rising prices.
- RSI Indicator: This indicator is at bottom of chart, which indicate a strength or weakness in script. One can easily observe it is also going up but facing resistance at falling trendline just like bitcoin approaching a resistance zone which i have indicated in yellow highlighted area in chart above. But clearance of falling trendline will give desire uplift to clear this resistance zone by Bitcoin price.
So, I am inclined to say in order to answer a question,"is correction over?" with positive node.
................................................................................................................................................................................................
Now its time to answer a question which i raised in headline i.e. Is there any possibility of hitting $3400+ in Near Future????
To find out answer of above question, lets take a look at another chart below.....
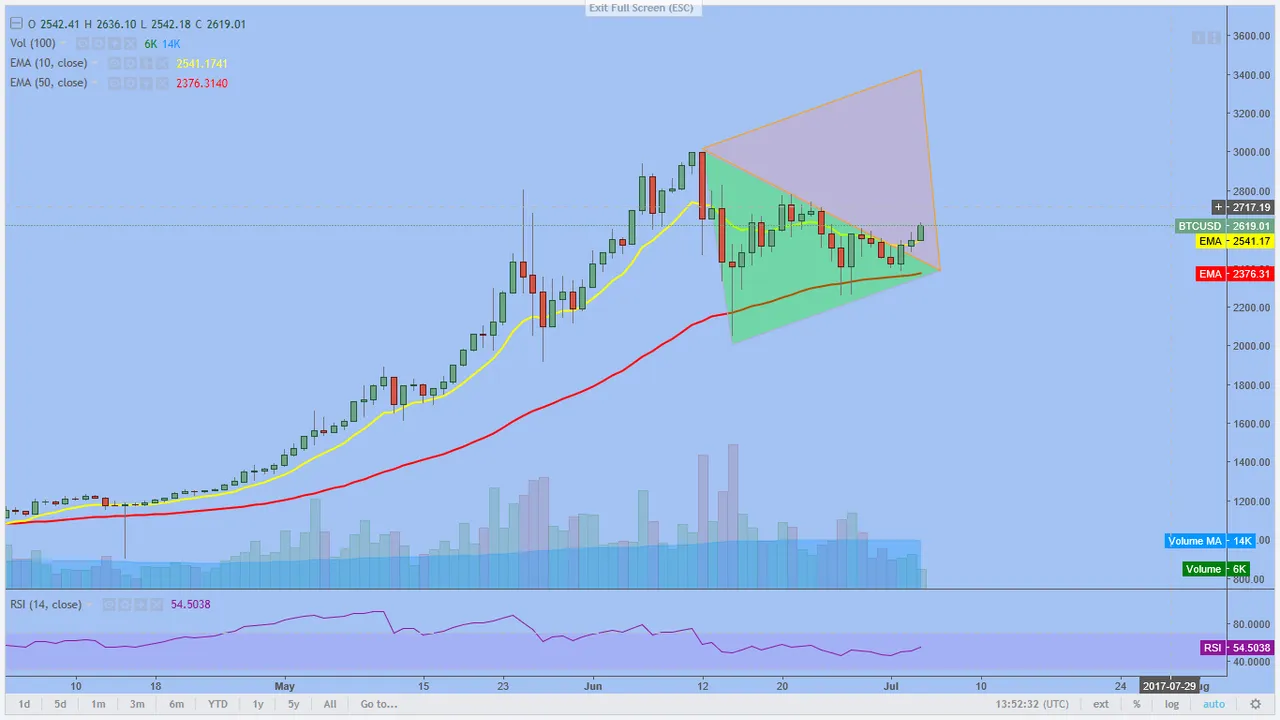
In chart above just look at highlighted area. The area in green is know as Symmetrical chart pattern. This pattern is formed in correction in uptrend where there are atleast three higher lows and three lower highs, and one can count these easily on above chart. As now, one can easily see that Bitcoin prices breakup from this triangle pattern, if i just flip flop this triangle in upside, target price come as $3431.
How i come to this level of $3431; Bitcoin corrected 1000 point from its high which is shown in left arm of green highlighted triangle above. Now when Bitcoin breached this triangle on upside, level was around $2500, when if you add 1000 point to this breakout level, target comes around $3500 which is also a upper point of pink highlighted triangle.
Generally, breakout from triangle pattern gives significant upmoves, so this target is very much possible not a mere speculation. Else time will tell how things pan out, and i rest my analysis here
________________________________________________________________________________
If you like my analysis do not forget to upvote, follow, comment@jimmyrai28
if not then criticize, this also will be highly appreciated.
You can also drop a comment in 'reply' if want you want me analyze any script of your choice.
Now you can also find me on discord channel: https://discord.gg/VvHmhvH